Dear Friends,
I hope this email finds you all safe and healthy during this unprecedented time with Shelter In Place. If there’s anything I can do to help you, please reach out.
In terms of my question in the subject line, the short answer is, no. At least, I don’t think so. It could slow down for a while but it won’t stay down forever.
1. Homes Are Still Selling: People are still putting their homes on the market even though the MLS has banned open houses and broker tours. There was a home that was put on the market in Redwood Shores for $2M this week and it sold in 3 days!
2. Off Market Listings: There are several homes listed as Coming Soon on both the Compass.com site as well as the Top Agent Network. I expect that when Shelter In Place is lifted, we will see a lot more inventory come on the market.
3. Offers Over Asking: A few of my colleagues reported that a few of their buyers got into contract this week. They reported that sellers are still expecting offer prices over the list price and that buyers are willing to pay over asking for the right home even though they aren’t in a multiple offer situation.
4. Legal Penalties for Showing Homes: A colleague told me an agent showed a vacant home in San Carlos this past weekend to a few of their clients. The neighbor saw 4 people congregating by the front door and called the police. The agent was fined $600 and received some sort of court order.
In terms of moving forward, while I don’t have a crystal ball, I personally believe that the market will slow down dramatically while Shelter In Place is in effect but it won’t come to a stand-still.
With people not making travel plans right now and with interest rates still historically low, I think the brisk Spring market will get pushed into the Summer which is historically a slower time of the year.
In terms of how a recession could affect our local real estate market, I will say that I’ve been through 3 significant recessions as an adult and homeowner. I worked in tech during the dot-com boom/bust as well as during the aftermath of 9/11. I became a realtor shortly before the 2008 – 2012 “Worst Recession since the Great Depression”. During those times I not only survived, but I always thrived afterward.
Our local real estate market has always come back higher than the last peak before the recession as you will see in the charts below. It just takes time and as I’ve always said, real estate is a long-term play.
We are going through a very scary and unprecedented time right now. It will be difficult. However, as my mom, who survived the Blitzkreig in London during WWII plus many other global crises after that, always reassured me during tough times, “This too shall pass”.
It’s just not easy going through it.
Again, if there’s anything I can do to help, please feel free to reach out.
Please stay safe and well! ~Caroline
[/et_pb_text][et_pb_text _builder_version=”4.0.9″]Market Cycles in Bay Area Real Estate
This article was written before the coronavirus – in fact, the first version was written over 10 years ago by our chief market analyst to help place the 2008 crash into context. We realize there are much more important things than real estate right now, but since some of our clients are trying to make decisions about buying and selling, we will continue to try to provide useful information on market trends and conditions. At this point, we cannot know how the current crisis will play out.
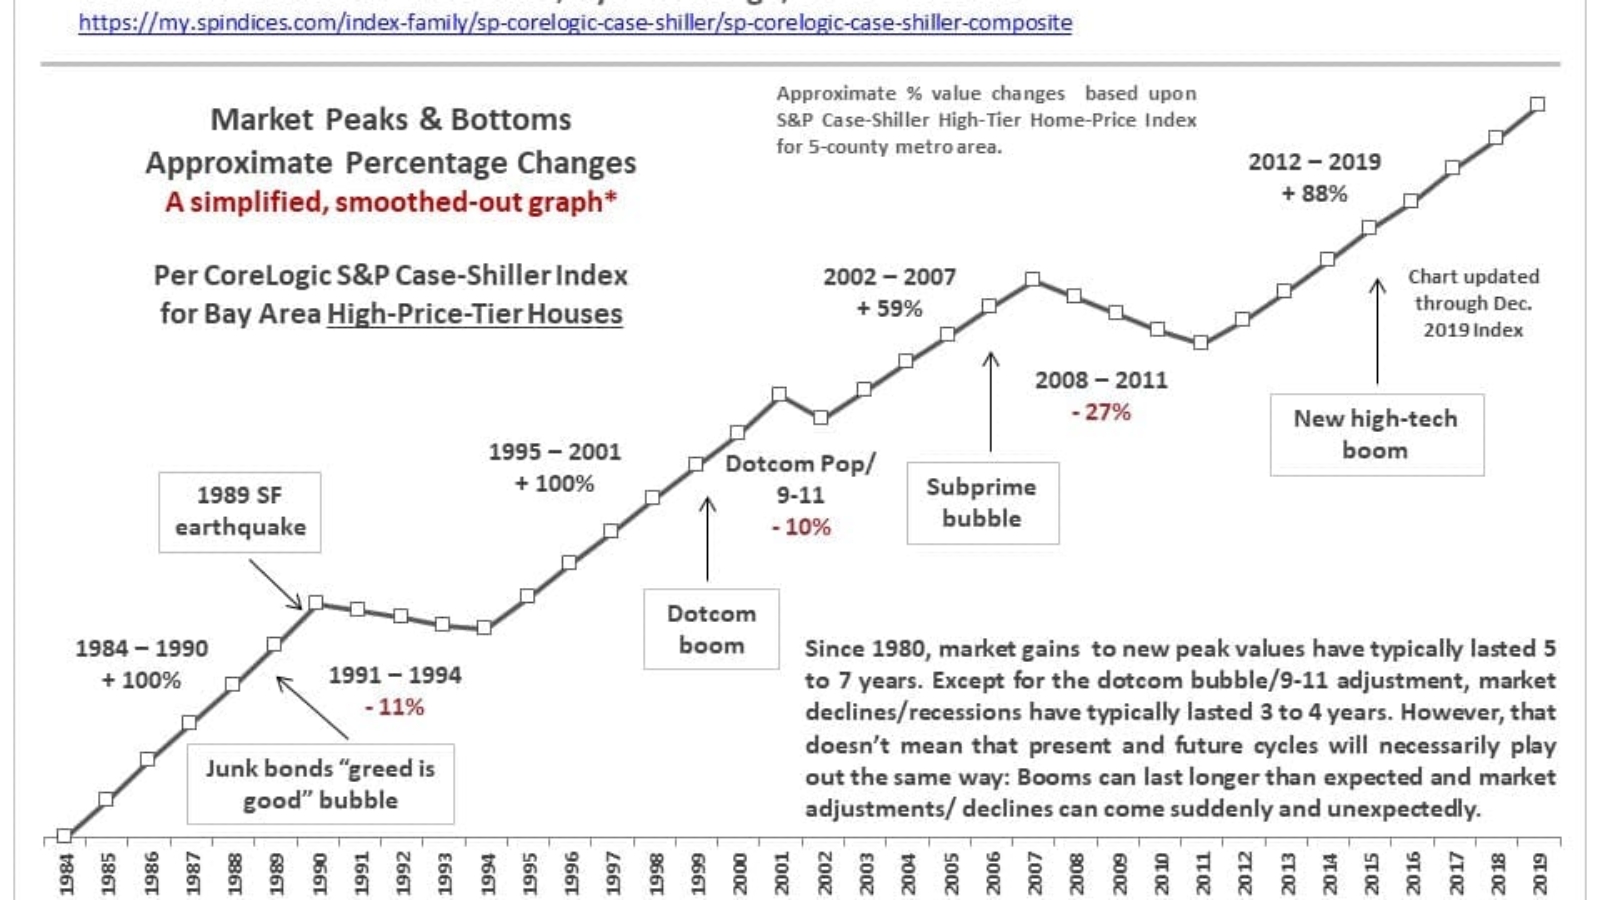
This first chart is a very simplified, smoothed out look at Bay Area market cycles for higher-price-tier homes using data from the S&P CoreLogic Case-Shiller Home Price Index. It is a very approximate overview of hundreds of different neighborhood markets – whose trends up and down were broadly similar, but whose details, such as specific appreciation percentages, varied.
[/et_pb_text][et_pb_image src=”https://carolinedinsmoreandco.com/wp-content/uploads/2020/03/san-francisco-bay-area-real-estate-market.jpg” _builder_version=”4.0.9″][/et_pb_image][et_pb_text _builder_version=”4.0.9″]The following chart uses the median house sales price trends of 5 Bay Area counties to illustrate a simple fact: The entire Bay Area generally follows the same broad trend lines in market cycles. Of course, there are differences by location, property type and price segment, but overall cycles are very similar. (We picked 5 counties as samples, because adding them all over-clutters the chart.)
[/et_pb_text][et_pb_image src=”https://carolinedinsmoreandco.com/wp-content/uploads/2020/03/annual-median-bay-area-house-sales-price.jpg” _builder_version=”4.0.9″][/et_pb_image][et_pb_text _builder_version=”4.0.9″]This chart uses yet another market-value tracking algorithm looking at the 2 biggest, multi-county “metro areas” in the Bay Area. Since they reflect multiple counties of highly varying values, the prices themselves don’t really reflect the prices of any specific market. The reason for the bigger drop post-2008 in the SF metro area is that portions of its 5-county area were more deeply impacted by the subprime lending crisis than the counties comprising the San Jose metro area.
[/et_pb_text][et_pb_image src=”https://carolinedinsmoreandco.com/wp-content/uploads/2020/03/Bay-area-median-house-value-trends.jpg” _builder_version=”4.0.9″][/et_pb_image][et_pb_text _builder_version=”4.0.9″]Financial-market cycles have been around for hundreds of years, from the 1600’s Dutch tulip mania through our recent speculative frenzy in crypto-currencies. Each market cycle has different characteristics in underlying causes and effects and how it ultimately plays out in its specifics. Still, there are fundamental similarities in all of them, providing more context as to how the market works over time.
Human beings have always been worried about (or terrified of) the future, and we have constantly attempted to predict what it holds. However, whether using priests, oracles, astrologers, economists, analysts or media pundits, we show no aptitude as a species for having the ability to do so with any accuracy. In 2012, a Nobel-Prize-winning economist, famous for housing market analysis, said that the U.S. real estate market might not recover “in our lifetimes.” In hindsight, we now know that the recovery had already begun in some markets such as San Francisco. In 2015, during a period of financial market fluctuations and a slowdown in our local high-tech boom, a well-respected Bay Area economist predicted that there would soon be “blood in the streets of San Francisco.” Within cycle phases, there are often shorter-term periods of economic, ecological and political volatility which then pass. In 2016-2018, housing and stock markets soared higher and the high-tech boom strengthened again.
Our smartest experts can’t get it right, much less the thousands of glib, confident forecasts by utterly unqualified individuals reported on in the media every month. We can’t even remember the mistakes of the recent past – one reason why we don’t seem to be able to escape the curse of recurring cycles – much less foretell what’s going to happen tomorrow. Which leads to the next point.
It is extremely difficult to predict when different parts of a cycle will begin or end. There is no rule regarding how long the different parts of a market cycle will last. Boom times, even periods of “irrational exuberance,” can go on much longer than expected, or get second winds, with huge jumps in values. On the other hand, negative shocks can appear with startling suddenness out of nowhere, often triggered by unexpected economic, political or even ecological events that hammer confidence, adversely affect a wide variety of market dominos, and then balloon into periods of decline and stagnation. These negative adjustments can be in the nature of a bubble popping, the slow deflation of a punctured tire, or some combination of the two.
Going back many decades, all the major Bay Area recessions have been tied to national or international economic crises. Considering the fundamental strengths of the local economy, absent a major natural disaster, it is unlikely that a major downturn would occur due simply to local issues. However, local issues can exacerbate a cycle: The 1989 earthquake intensified the effects of the national recession in the early 1990’s; our greater exposure to dotcom businesses produced a spike up and down with the NASDAQ bubble & 2000-2001 crash; and our current high-tech boom poured fuel on our up-cycle during the current recovery.
All bubbles are ultimately based on irrational exuberance, runaway greed, criminal behavior, or all three mashed up together. Whether exemplified by junk bonds, stock market hysteria, gorging on debt, a corporate Ponzi-scheme mentality, an abandonment of reasonable risk assessment, and/or incomprehensible and dishonest financial engineering, the bubble is relentlessly pumped bigger and tighter.
However, the 2008 crash was abnormal in its scale, and much greater than other downturns going back to the Great Depression. The 2005-2007 bubble was fueled by home buying and refinancing with exorbitant, unaffordable levels of debt, promoted by predatory lending practices such as deceptive teaser rates, no-down-payment loans and an abysmal decline in underwriting standards. The market adjustments of the early 1990’s and early-2000’s saw declines in Bay Area home values in the range of 10% to 11%, as compared to the terrible 2008 – 2011 declines of 20% to 60%. (Bay Area prices are now above their 2007 peaks.)
Whatever the phase of the cycle, many people think it will last forever. Going up: “The world is different now, profits don’t matter, the rules don’t apply anymore, and there’s no reason why the upward trend can’t continue indefinitely.” Well, it turns out that the rules do still apply, and up-cycles always end sometime. And when the market turns: “Homeownership has always been a terrible investment and the market will not recover for decades.” But the economy mends, the population grows, people start families, inflation accumulates over the years, and the repressed demand of those who want to own their own homes builds up. In the early eighties, mid-nineties and in 2012, after about 4 years of a recessionary housing market, this repressed demand jumped back in – or “exploded” might be a better description – and home prices started to rise again. The nature of cycles is to keep turning.
As long as one doesn’t have to sell during a down cycle, Bay Area homeownership has almost always been a good or even spectacular investment (though admittedly if one does have to sell at the bottom of the market, the results can be quite painful). This is due to the ability to finance one’s purchase (and refinance when rates drop), certain tax benefits, the gradual pay-off of the mortgage (the “forced savings” effect), inflation, and long-term demographic and appreciation trends.
The best way to overcome cycles is to buy a home for the longer term, one whose monthly cost is readily affordable for you now, ideally using a long-term, fixed-rate loan (refinancing to lower rates when that option opens), while keeping an adequate financial reserve for emergencies – and then resisting the urge to use one’s home as an ATM during times of significant appreciation. If one keeps to those rules, then it is usually true, quoting a NYT editorial, “Renting can make sense as a lifestyle choice… As a means to building wealth, however, there is no practical substitute for homeownership.”
————
Market Changes & Home-Price Segments
The next chart, also based on S&P CoreLogic Case-Shiller Home Price index data, illustrates an important point about the last market bubble and crash: Different price segments experienced bubbles and crashes of vastly different magnitudes, mostly due to each segment’s exposure to predatory subrprime lending practices and the foreclosure crisis that followed. It was the lowest price segment that was most drastically affected by subprime lending: The blue line reveals its vastly bigger bubble and commensurately enormous crash. All Case-Shiller numbers refer to a January 2000 value for any home of “100.” Thus a reading of 250 signifies appreciation of 150% since Jan. 2000.
The 2008 crash was an anomaly caused by the fact that tens of millions of Americans bought and refinanced homes with loans they could not afford on day one. Happily, underwriting standards have recovered from the abysmal standards of the subprime bubble. That and low-interest rates, so far, have kept mortgage debt well out of the danger zone.
It’s also interesting to note on this chart that when the dotcom bubble popped, only the higher-price home segment was significantly affected (and that relatively briefly), because more affluent households have more assets invested in financial markets, and follow those changes most closely.
[/et_pb_text][et_pb_image src=”https://carolinedinsmoreandco.com/wp-content/uploads/2020/03/Corlogic-sP-case-shiller-home-price.jpg” _builder_version=”4.0.9″][/et_pb_image][et_pb_text _builder_version=”4.0.9″]The Confluence of Economic Indicators
The 3 charts below show how real estate market cycles generally move in sync with other economic indicators such as – using 3 examples – financial markets, employment and consumer confidence. The S&P 500 chart goes through the end of 2019 and does not reflect the crazed volatility created by the coronavirus situation.
[/et_pb_text][et_pb_image src=”https://carolinedinsmoreandco.com/wp-content/uploads/2020/03/SP-500-stock-index.jpg” _builder_version=”4.0.9″][/et_pb_image][et_pb_image src=”https://carolinedinsmoreandco.com/wp-content/uploads/2020/03/San-Francisco-bay-area-employment-trends.jpg” _builder_version=”4.0.9″][/et_pb_image][et_pb_image src=”https://carolinedinsmoreandco.com/wp-content/uploads/2020/03/Consumer-sentiment-index.jpg” _builder_version=”4.0.9″][/et_pb_image][/et_pb_column][/et_pb_row][/et_pb_section]